Collision events seen by ATLAS
Beams of protons are accelerated around the Large Hadron Collider (LHC) and are brought to collision at the centre of the ATLAS detector. The collisions produce debris in the form of new particles which fly out in all directions. Over a billion particle interactions take place in the ATLAS detector every second.
The protons within the two beams are grouped in bunches which are squeezed down in size to increase the chances of a collision. In the released data, the bunches crossed every 25 ns. The event reconstruction is affected by multiple inelastic pp collisions in a single bunch crossing and by collisions in neighbouring bunch crossings, referred to as "pile-up". The number of interactions per bunch crossing ranges from about 8 to 45.
An event is the data resulting from a particular bunch-crossing. The 13 TeV ATLAS Open Data events belong to 61 runs from the first four periods of the 2016 pp data-taking and contain approximately 270 million of collision events.
Luminosity is one of the most important parameters of the LHC. The higher the luminosity, the more data the experiments can gather to allow them to observe rare processes. The released 13 TeV ATLAS Open Data collision events, after applying quality criteria for the beam, data and detector, correspond to an **integrated luminosity of 10.06 ± 0.37 fb-1 **.
In a typical collision event, several vertices along the beam are produced and the primary vertex is defined as the vertex with the largest sum of the squares of the transverse momenta of associated tracks. The reconstruction of vertices is important for many physics studies, which include: searches for new particles, identifying jets containing b-quarks or tau-leptons.
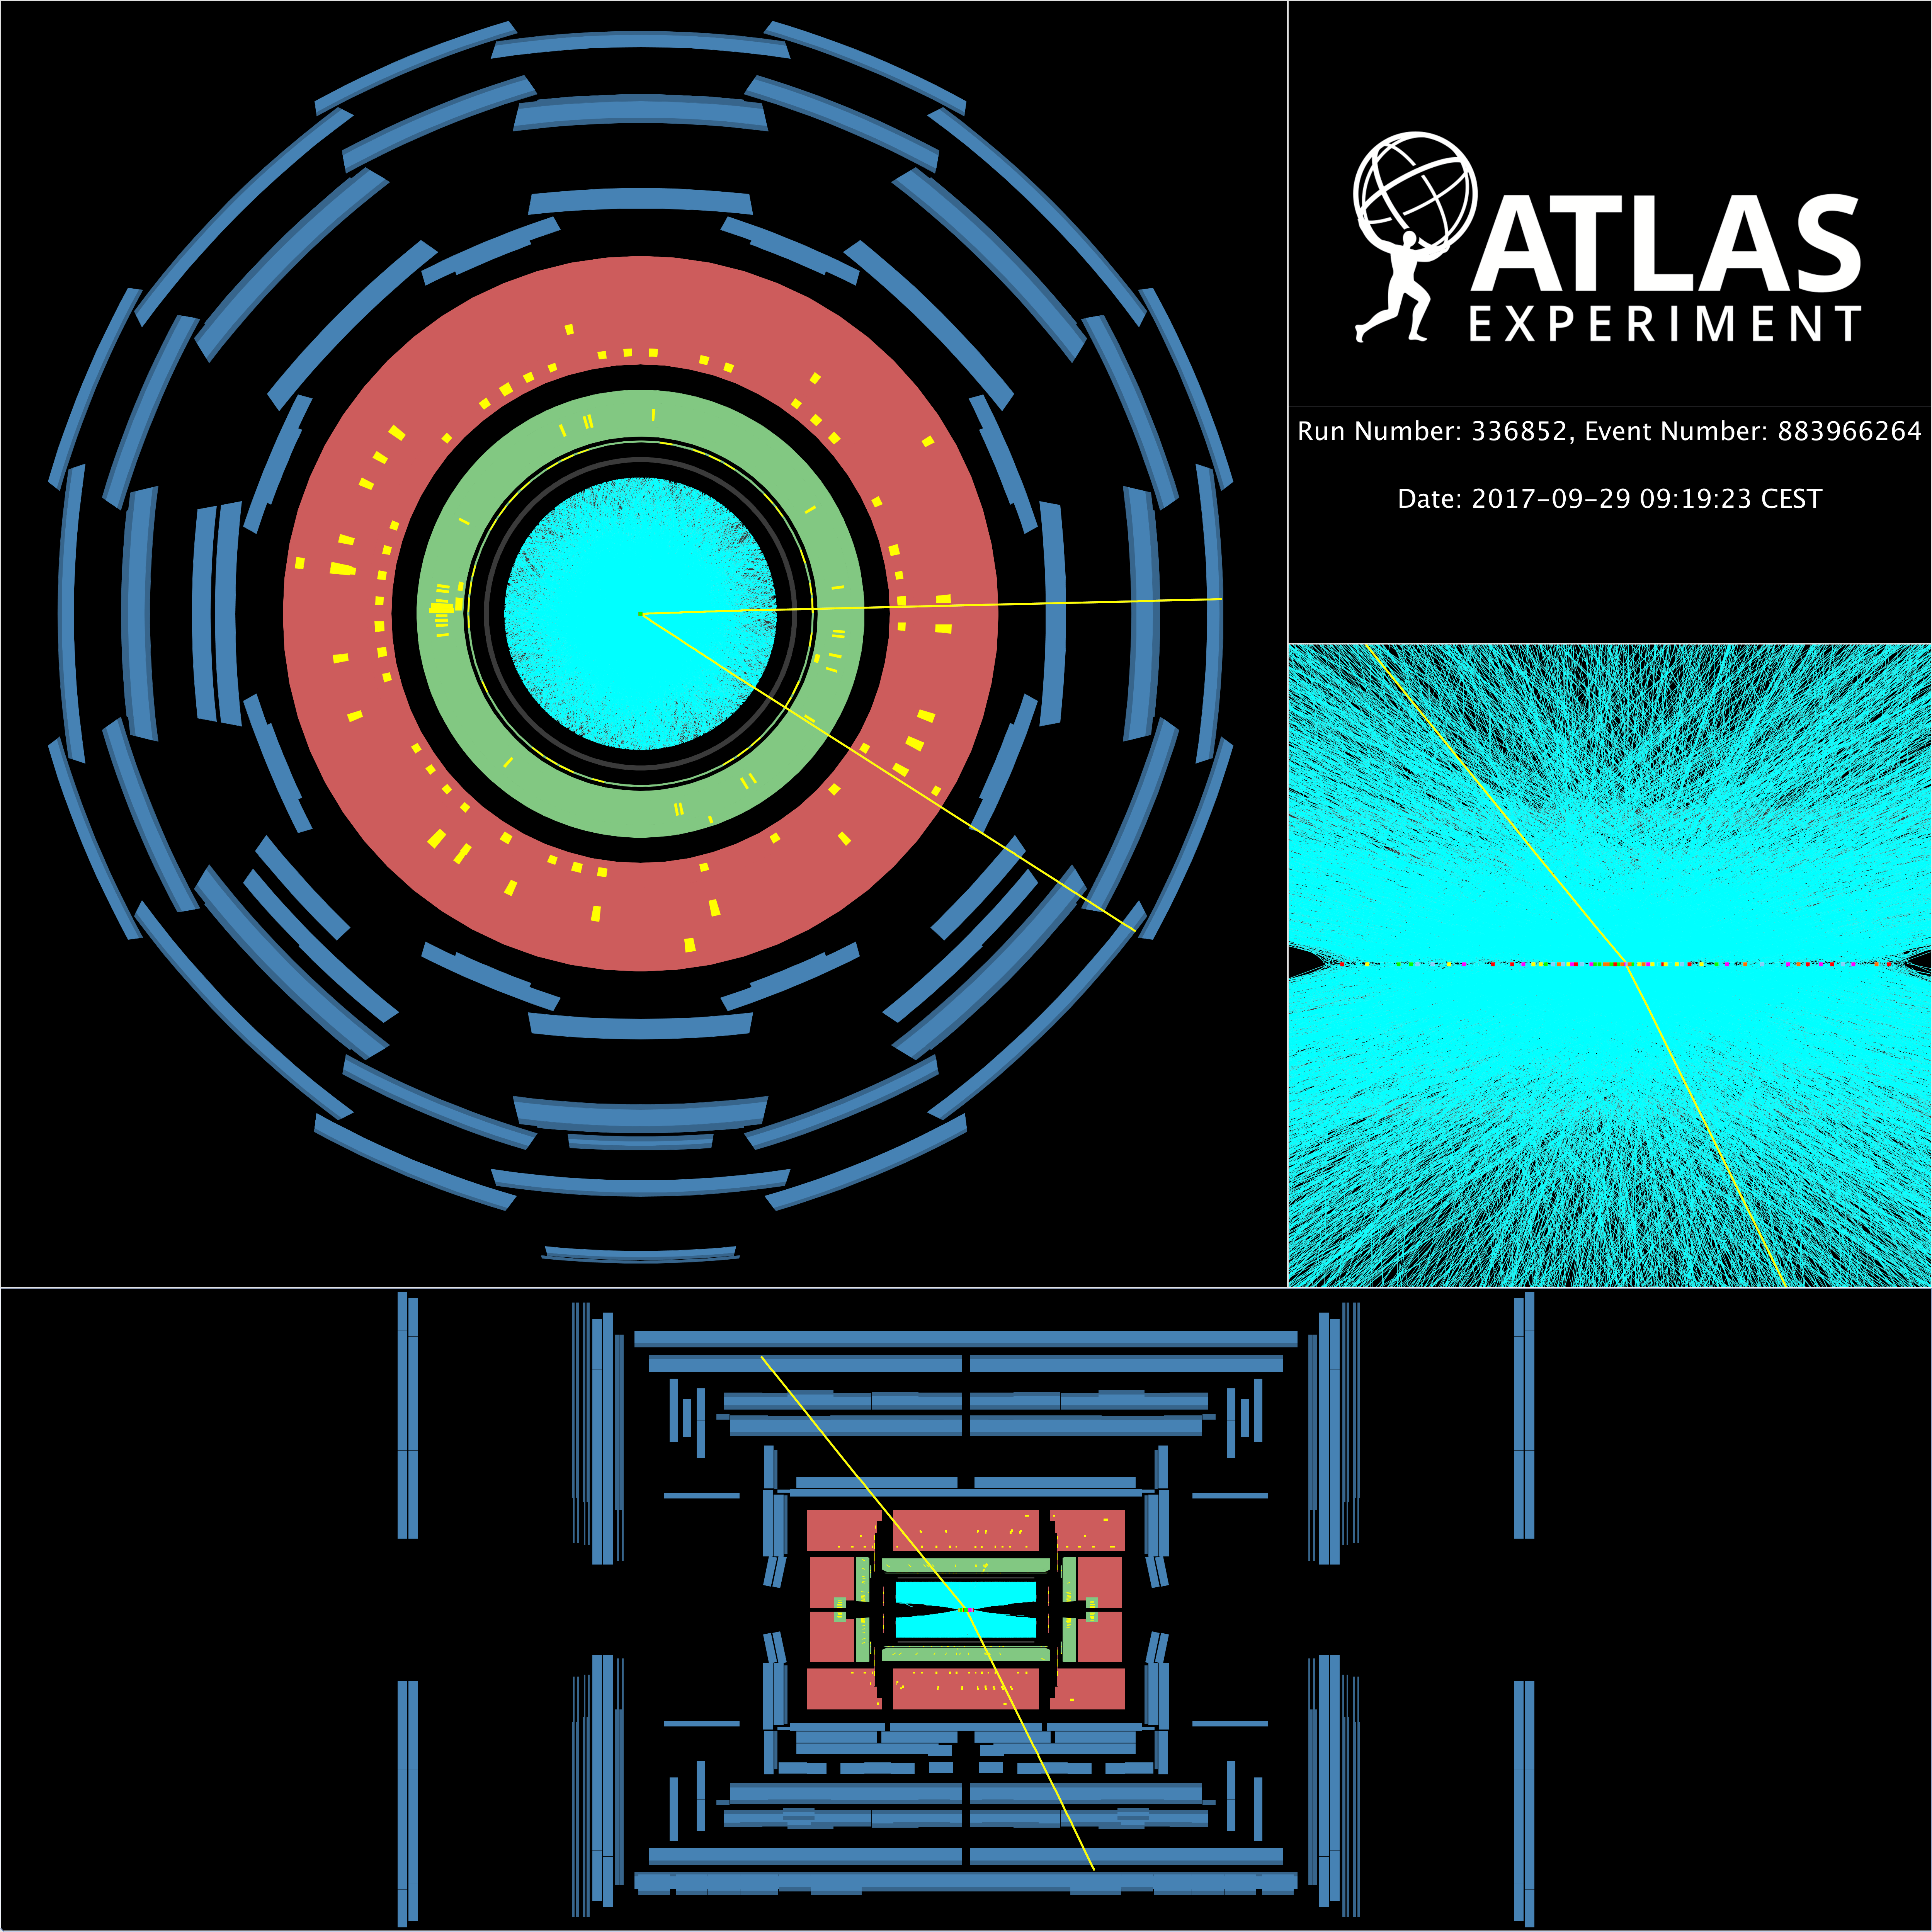
The event display below shows a Z-boson decaying to two muons candidate event from proton-proton collisions recorded by ATLAS with LHC stable beams at a collision energy of 13 TeV on the 29th of September 2017. The Z boson candidate is reconstructed in a beam crossing with 65 additionally reconstructed vertices. The upper left display presents a transverse view of the event (X-Y plane) where the yellow lines show the two muons' paths. The upper right display shows the 66 reconstructed vertices. The bottom display presents the event in longitudinal view (Z-Y plane). Tracks with transverse momenta large than 100 MeV are displayed.